
A better insight into the way WPI questions are answered
Consistency, Self image and Response tendency have been added to the Work-related Personality Questionnaire (WPV) report in order to provide greater insight into the way in which the questions were answered in the report. This article describes these metrics and how they can be interpreted.
Preventing bias
Let’s assume you have requested a respondent to complete a personality questionnaire. How confident are you that the profile matches the respondent and that you have not been misled? A questionnaire can be as reliable and valid as they come, yet the exactitude of the outcome can never be absolutely guaranteed. Biases related to social desirability, response tendency and consistency are always a risk. Although research shows that the chance of a distorted profile is relatively small, misrepresentations can occur. How can you be assured of profile accuracy? In order to facilitate this, we have added three metrics to the Work-related Personality Questionnaire report. These metrics reveal the pattern behind the given answers.
Social desirability and personality
During the test interpretation workshops that I moderate, I am often asked if a Work-related Personality Questionnaire is corrected for socially-desirable answers. I reply by saying that this is not necessary because the Work-related Personality Questionnaire contains more than one norm group. In advisory situations, there is little reason for answering in a socially-desirable manner – and it rarely happens. In this scenario, it is important for the respondent to acquire as objective and reliable an impression of the personality as possible. It is different for selection scenarios. Here, it is not for a respondent to find out what makes them tick. No, it is about showing that their personality aligns with what the organisation is looking for. By making use of a selection norm group, socially-desirable answers are automatically corrected. You know with almost absolute certainty that socially-desirable answers are given in a selection situation.
The ‘information’ behind the reply pattern
It is however interesting to look at a respondent’s reply pattern. Is a respondent replying in a consistent manner or are the answers to two items with a high correlation value far apart? Is the respondent replying in a critical fashion, or does he think highly of himself? And does the respondent make use of extreme reply options of does he steer towards the middle of the road? In order to answer these questions, we have added three metrics to the Work-related Personality Questionnaire: Consistency, Self image and Response tendency. These metrics enable you to access the information behind the reply pattern. Permit me to run you through the metrics.
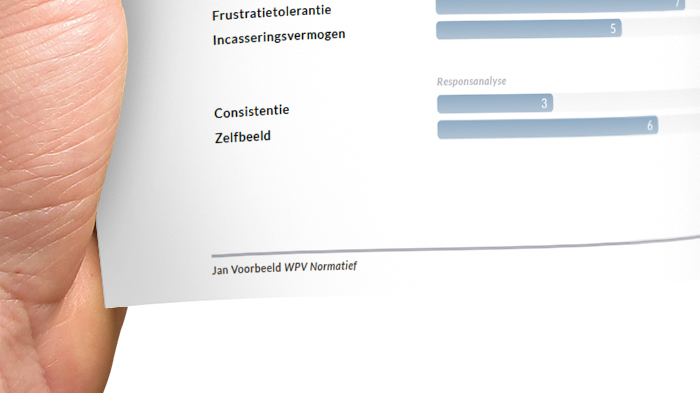
Consistency
The name says it all. This metric indicates how consistently the respondent has completed the questionnaire. This helps us to assess whether we can take this profile seriously or if we need to take a more critical look. A very low consistency score suggests that answers have been provided at random. In the norm group, we went in search of item pairs with a high correlation factor. We looked at item pairs within one’s own scale or factor as well as item pairs outside one’s own scale or factor. We found a total of 48 item pairs with a high positive or negative correlation factor. The respondent’s deviation with respect to these item pairs is then compared to the norm group. In the report, a high score in the tables implies a consistent reply pattern. A low score means that the questionnaire has been completed inconsistently.
Suggestions for discussing Consistency
With very low scores of three or under, the results should be interpreted with caution. There is a chance that the respondent has answered at random. During the discussion of the report, you can always ask how the respondent filled in the questionnaire. An indication could be the time he took to do so; the average completion time is between 30 and 40 minutes. It can also be worthwhile to ascertain if the respondent fully understood the questions. A final tip is to ask the respondent to describe himself with the help of a number of personality traits. You can then see if his description is in line with the report results.
Self image
This metric indicates the degree to which a respondent demonstrates a critical or positive self image. A low score suggests a very self-critical attitude, a high score a positive self image. The score is compiled by looking at the candidate’s competence scores. If the respondent is only shown above-average scores on the competence indicator of the Work-related Personality Questionnaire, then this contributes to a high score and a positive self image. A low score on the competence indicator contributes to a lower score and a more critical self image.
Biases of Self image
Self image can often be spot on, because positive or extravert personalities tend to complete the questionnaire with a certain zest. They choose extremes more easily than more modest people with a more self-critical attitude. It is also true that the way in which the personality profile is filled in can be too critical or positive. Someone with a critical self image can sometimes be too critical of himself and subsequently score lower on the competence indicator. A highly-successful manager who is a bit of a perfectionist had a highly critical self image – to his detriment! The competence indicator came up with scores that were too low. On the flip side I have worked with someone who scored highly due to his desire to create a positive impression of himself. The Self-image metric provides insight. Moreover, Self image in this context is not the same as Self confidence, despite the obvious correlation. The Self image score can be seen on all scales.
Tips for discussing Self image
The questionnaire can also indicate if the Self image score is in line with reality. During the debriefing it is important to reflect on extremely high or low Self image scores. It is advisable to ask for tangible examples in the case of a high score (+8). Ask the respondent for an example of a situation when things went well as well as for a situation that left room for improvement. You can also ask questions such as: what kind of feedback have you had from your manager in terms of points for improvement, what personality traits of yours actually irritate your colleagues? Ask the respondent with a low Self image score (<3) to quote situations where things went well. Ask for the positive things his manager may have said or for personality traits that colleagues appreciate. Finally, ask if the respondent recognises himself in the positive answers provided or if he thinks differently about them and, if so, why?
Response tendency
The reply scale of the Work-related Personality Questionnaire is a five-point Likert scale that runs from ‘Absolutely disagree’ to ‘Absolutely agree’. The response tendency indicates the deviation per reply option from the answer given by the respondent to that of the norm group. The norm group indicates how often a given reply option is chosen. The number of times each reply option is clicked during completion of the Work-related Personality Questionnaire is counted and compared to the norm group average. The Work-related Personality Questionnaire report shows the deviation as compared to the norm group per reply option in percentages. When the graphical representation shows a negative percentage, that means the respondent clicked the relevant reply option less frequently. A positive percentage indicates that the reply option was chosen more frequently than in the norm group.
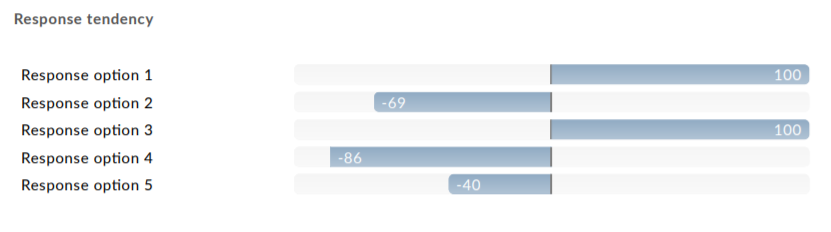
The example above shows the candidate actually emphasised extremes very strongly, the one and the five were selected and used over 50% more frequently. That can lead to extreme scores in the graph. When considering the Consistency and Self image metrics, this candidate has answered the questions consistently. The Self image scores are neither extremely positive nor negative. In this case, the conclusion can be drawn that the deviating reply pattern has not led to misrepresentation in the report.
Tips for discussing Response tendency
Generally speaking, response tendency indicates whether someone dares to choose extremes or if he is wary of taking risks. Deviations per reply option of around 25% may be considered ‘normaal’. Deviations above this percentage should be reviewed with all due care. Did the respondent provide more extreme scores than the norm group, so more frequently a 1 and/or 5 option and less frequently a middle-of-the-road option? Ask him how he takes decisions and if his decisions have occasionally backfired. Or did the respondent provide safer scores, so more frequently a 3 option and less frequently a 1 and/or 5 option? Then ask him for situations in which he dared to take a risk and where he had to take a tough decision.
Absence of Consistency and Response tendency measurements in the Adaptive WPI
The Adaptive WPI does not report on Consistency or Response tendency. With the Adaptive WPI, the questions that will produce the most information about a specific candidate are selected. Questions are asked until a reliable determination can be made. When a candidate gives inconsistent answers, more questions are asked until a sufficiently consistent picture is obtained. In other words: The questionnaire itself already takes consistency into account.
Due to the adaptive character of the questionnaire, it is also not possible to calculate Response tendency in the same way as with the Normative WPI, for example. This is because, amongst others, different candidates do not see the same items and the same number of items. The answer patterns cannot be compared to a norm group because the composition of the questionnaire was different for each candidate
In conclusion
The inclusion of Consistency, Self image and Response tendency should make it easier for advisors to see how candidates complete the questionnaire. In cases where the scores for these metrics fall within the standard deviation, you can be sure that the respondent has completed the questionnaire in a reliable manner. That does not automatically mean, however, that a respondent with scores outside the standard deviation has been dishonest! In this case, it is important to ask the respondent to provide a little more background during the debriefing.